Quarterly sales and marketing reporting and insights template
Craft effective quarterly reports to track team performance and optimize your tactics
How will this quarterly reporting and insights template help me and my business?
To get the most out this template and your reporting, you will need to have clear marketing KPIs in place that relate back to your business’ overall strategy. We split ours across the RACE Framework to clearly monitor actions taken at each stage of the customer funnel: Reach, Act, Convert and Engage. In this resource, we explain how you can set up KPIs so your team all have a clear idea of how their work is contributing to overall business success, and how you can build these metrics into your own RACE dashboard to make reporting easier.
How is this guide structured?
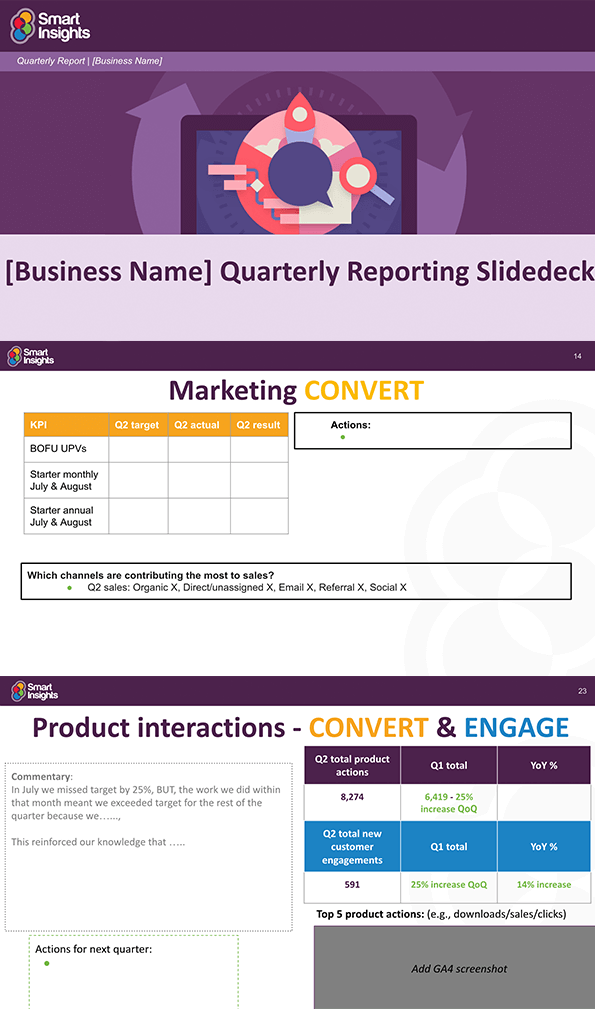
The slide deck has been created in Google Slides and is structured around the three core business areas: Sales, Marketing and Product. For larger organizations with more departments, feel free to add more sections. It also includes a manager overview, space for team training updates, and how you can turn your insights into your next 90-day plan.
The deck follows this structure:
- Introduction slides
- Manager overview
- Quarterly Marketing report
- Quarterly Sales report
- Quarterly Product report
- Team training update
- Quarter summary
- 90-day planning
To create a report for your business, go to File > Make a copy, to get your own editable version of the deck.
Resource Details
- Author: Amelia Cooper, Smart Insights
- Format: Google Sheets slidedeck
- Recommended resources:
About the author
Amelia Cooper

Amelia Cooper is Head of Content at Smart Insights. She is responsible for managing the paid member content library and e-learning resources, as well as strategic planning to ensure customers get the most from their memberships. She is a University of Southampton and the Chartered Institute of Marketing graduate with over 8 years’ experience in digital marketing, specializing in content marketing.

 Professional Membership is required

 Free membership


